
The following is a guest post from author and principal designer Erin Weigel. Read on for an exclusive look inside her new book, “Design for Impact: Your Guide to Designing Effective Product Experiments”.
User research is in crisis. Rounds of layoffs gutted this valuable skill in many organizations. Why?
Because we’ve failed to connect our research to business metrics that matter.
Companies that keep and connect research to value-creating work will push through the current “economic headwinds” and come out on top.
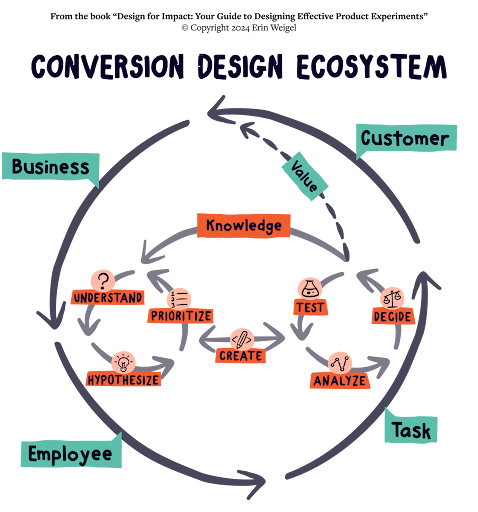
Luckily, there’s a strong force to propel your company forward: Conversion Design.
The Conversion Design process starts with understanding your customers, and it ends with measurable business value creation.
How? By conducting customer research through the lens of important business goals.
In the following passage from my book, Design for Impact: Your Guide to Designing Effective Product Experiments, you’ll learn a research approach that moves your metrics forward. The approach draws a direct thread between the actionable insights you uncover and the metrics you aim to move.
Research is Formalized Curiosity
Curiosity is an important characteristic in experimentation, and research is an expression of that curiosity. As Zora Neale Hurston, an American author and anthropologist once said, “Research is formalized curiosity. It is poking and prying with a purpose.”
Poking and prying alone doesn’t make an impact, though. You must harness and direct it. The “Understand” phase of Conversion Design does just that by discovering real customer problems that, when solved, are likely to make a positive impact. To do that, you must focus on the top customer issues by looking at them through the lens of important business goals.
Research should be viewed through the lenses of your business goals.
Many companies have priorities, success metrics, and goals. If your company doesn’t, you could learn what’s important by understanding how the company serves customers, makes its money, and where those two things overlap. Then you can create a list of top customer tasks that align with those goals.
Top customer tasks are the main things that people want to do when they use a product or service. If you need more information, use the product yourself, or watch someone else use it. You want to learn the flow and the tasks that need to be done. As you use the product, write down your observations. Questions to ask yourself are:
Where do people make errors?
Is any language unclear?
Where might people hesitate?
What common mental models and design patterns are broken?
Does anything seem particularly slow?
Once you have a list of observations, it’s time to define your research question.
Ask Questions to Collect Data
A research question is a clear, simple question that you want to answer by studying and collecting information. Research questions can provide answers in two forms of data: qualitative and quantitative.
Qualitative data are facts that don’t involve numbers. Some examples of qualitative research are behavioral observation (ethnography), open questions on surveys, and diary studies.
Quantitative data are facts expressed as numbers. Some examples of quantitative research are analytics, A/B testing, and closed questions on surveys.
Although many types of research questions exist, the following ones provide preliminary and secondary insights, which give you a solid foundation for research within experimentation. Two question types to uncover preliminary insights are the following:
Exploratory. These questions are broad and help you observe and understand something without bias. Use them when you want to learn broadly about something where there’s little existing knowledge or understanding. An example is: “How do people decide what refrigerator to buy?”
Descriptive. These questions seek to explain when, where, or how many times something happened. They are the most basic kind of research question. An example might be: “How many people clicked on the main call-to-action button within the last month?” It’s simple and clear.
After you find something interesting to dig into, then ask the “why” and“what-if” questions:
Explanatory. These questions aim to explain why something happens.They are often used to delve deeper into a preliminary insight.They usually start with “why.” An example is: “Why do people drop off in the payment step of the buying process?”
Relationship-based. These questions seek to understand if one thing impacts another. This question type provides the backbone of experimentation. An example might be: “Will more people make a purchase if we add a product comparison tool?” After you write your research question (what you hope to learn), then you choose your research method (what you’ll do to learn it).
Choose the Right Research Method
Different research methods—just like research questions—uncover different types of insights. Christian Rohrer, a design strategist and author, created the “Landscape of User Research Methods” to help you choose your research method.
This matrix captures the spectrum between behavioral and attitudinal insights and plots them against qualitative and quantitative data output.
One axis describes what the research actually documents—for example, behavior or attitude. The other shows if the result gives you qualitative or quantitative information. Research methods dot the landscape, and their position shows the types of insight they uncover: qualitative, quantitative, or a mixture of both. The landscape also illustrates the three types of product use within research:
Natural use. People do what they want without influence.
Guided use. People get tasks to complete and prompts to follow.
Decontextualized use. People are asked questions about a product, but not while using it.
Consider these things when you choose a research method:
The research question. Start your study with a clearly defined research question that ties back to a business goal.
The insight needed. The type of insight depends on whether the research must identify needs or inspire ideas about how to address them.
Product maturity. If the product is immature, it’s likely to need discovery. If the product is mature and insights exist, then understanding how to fix known issues is more important than uncovering new ones.
Available resources. Timelines, employee skills, and research investment vary from business to business.
Access to data and information. Data protection laws and security mean that not all information is available to everyone. Learn what type of data can be collected and used.
TIP: WHEN TO USE QUANTITATIVE VS. QUALITATIVE
If no clear user problem or need exists, quantitative research helps you dig into the“what, how many, or how much.” If a clear need exists, then qualitative research helps address the “why” and “how.”
Choose the Right Research Environment
The last thing to consider is your research environment. Environments shape human behavior, so your choice influences the quality of your observations.
Controlled environments are professional spaces where researchers can conduct the test and prepare logistics beforehand. Examples are the researcher’s office, usability labs, and observation studios. These are good for in-depth general insights, such as usability baselines, moderated studies, or user interviews.
Remote environments are software solutions that allow participants to choose a spot that works best for them. Examples are remote usability study software, card-sorting tools, and digital diary studies. These are good for lightweight, general feedback on how people interpret content and find basic usability issues.
Natural environments are where your participant typically uses your product or service. Examples are the participant’s home, school, or workplace. Natural environments are important for products that involve human, physical object, or location-based interactions. If context is crucial, go to where the issues happen to observe exactly what’s going on.
TIP: “BYOD” (BRING YOUR OWN DEVICE)
Regardless of where you do your research, be sure to have participants use their own mobile device, computer, or hardware. When participants use an operating system or device they’re not used to (or familiar with), it’s hard to tell if an issue is caused by the product you’re testing or the hardware and its software. Observing a participant using their own device also uncovers information about these customer features:
• Settings, such as device language, notifications, sound and haptics, special keyboards, brightness and color, etc.
• Shortcuts, such as prioritized apps in the toolbar, gestures to activate certain features, navigation between screens and apps, autocomplete, etc.
• Adaptations, such as personal changes or hacks made to the device, so it works how they want it to.
Explore Data from Behind Your Desk
Data can be collected continuously and analyzed whenever a question arises. Many ways to get inspiration for your experiments are not only fast and affordable, but they can be fun, too.
A great place to look first, which many companies collect in the background, are in the reporting analytics. These are numerical data about a product’s performance and usage such as Google Analytics. Here are some research questions to get you started:
Where do people drop off? Why do they leave?
Where do they spend a lot of time? Does it make sense that they spend a lot of time there?
Where do they go when they leave an important screen? Do they go where they’re supposed to go? Or do they get lost somewhere?
The answers to the bolded descriptive questions can lead you toward some deeper qualitative research via the follow-up explanatory or interpretive questions. Click maps are a visualized form of reporting analytics. They show where and how often people interact with elements of a user interface (UI).
All clicks, even ones on non interactive elements, are logged. If you notice many people clicking on non interactive elements, ask yourself: “Why do people click there?” Then try these follow-up research questions:
Did the user want more information? If so, what information?
Did they think it was a link? If so, where did they hope it would take them?
Was it a misclick? Were they trying to click something else? If so, what?
TIP: TEST REMOVING THINGS
Highly impactful products pack every pixel with value. If you notice that people don’t read or interact with something, and it’s not legally required—test removing it. Removing things can be just as good as—and sometimes better than—adding or changing things.
Customer Service Contact Logs
Customer service agents deal with all the problematic issues that a product creates or doesn’t solve. Most customer service systems allow representatives to tag issues with specific topics. Topic tag examples might be:
Account access issues
Subscription cancellations
Failed payments
Billing questions
TIP: CREATE A TOP 10 LIST OF CUSTOMER PROBLEMS
From your tagged customer service data, create a top-10 customer issues list. Note how often the issues happen, as well as time-to-resolution. With this information, you can quantify the impact of the issues for both the customers and the business. Time wasted for customers and money spent on the employee who handles each issue make great metrics to track and measure. Share the top-10 list through the company, and eventually the issues on the list will change as problems get solved through experimentation.
Review, Rating, and Reputation Sites
Two types of users, promoters and detractors, can provide a wealth of insight. Promoters are people who enjoy and proactively discuss a product or brand in a positive way. They are a company’s most valuable customers because their opinions often influence the opinions and actions of others. Detractors are people who have a mediocre or bad experience and actively talk poorly about your company or product. Common places to find your promoters and detractors are reviews, ratings, and reputation sites.
These tools, which are run by third parties, provide a way to understand people’s real experiences with and feelings about a product or business. Dig into both the combined ratings (aka aggregate score) and the individual reviews and ratings.
If the ratings and reviews look good, awesome! This reassures potential customers.
If they aren’t, dig into the “why.” Look for negative patterns in the reviews and experiment with them.
TIP: REDDIT, SUBSTACK, AND YOUTUBE CAN BE RESEARCH GOLDMINES
If your product is discussed online in forums such as Reddit or Substack—read and act on the feedback! These folks are often passionately for or against your product, and they aren’t shy about sharing their honest opinions.
Surveys
Micro surveys are one to two questions that are targeted to appear at a specific time when someone uses a product. They can help you quickly understand what your users think, do, and feel. Because they’re short, they take little time to design, run, and analyze.
Depending on the design, they can collect qualitative data, quantitative, or both.The type of data you get depends on the types of questions you ask—open or closed.
Open questions allow people to answer in their own words in a text field. This data gives people freedom to express their thoughts with nuance, which gives you a rich form of qualitative data.
Closed questions provide predefined options for respondents to choose from, such as yes/no, multiple-choice, or ticked box options. This type of survey question gives you quantitative data.
Experiment to Learn
Another way to understand the dynamics of a product is to “play” with it. Ask yourself these questions to get ideas about what to “play” with:
What information do customers need? Is that information where they expect it? Can everyone access it? And does it load fast?
What do the headlines and subheads say? Do they contain the words the customers use and are looking for? Do they make sense?
What are the most-used actions? Can everyone access them? Are they easy to do?
Answering these questions in an unbiased way is hard—especially if you’re very familiar with your product. You can use A/B tests to move content, remove elements, and emphasize things you have evidence to believe are important so you can actually learn if they’re important or not.
This may seem irresponsible, but “purposeful play” is an effective and fun form of exploratory research that can lead to big customer and business impact.
Experimenting to learn helps you understand the value of each element on the page in its current state. Once you understand how it is or is not working, you can design meaningful improvements.
Redesigns often fail because of the number of assumptions that get made about what’s important. But big design leaps are often easier after experimenting to learn. It’s possible that moving, changing, or removing one thing can make a whole redesign fail. Experimenting to learn helps you prioritize impactful content and interactions in the new design, to make it more likely to succeed.
Need a partner in designing effective research?
Convince & Convert has decades of experience with helping brands with research strategy and delivery. Contact us to learn more.
Read Design for Impact for more research tips to move your metrics forward.
Design for Impact is available globally from the publisher at RosenfeldMedia.com. Every paperback purchase comes with the ebook version FREE.
Buy Design for Impact directly from the author, Erin Weigel, within the EU at ErinDoesThings.com. Get a FREE “Make things better, not just different” sticker for your laptop.
Buy Design for Impact online wherever books are sold such as Amazon, Barnes & Noble, and Target.com.
The post Research Methods for Impactful Insights About Your Brand appeared first on Convince & Convert.